Making Python Fly: A Practical Guide to Efficient Code
Python is famous for its simplicity and readability, but it has a reputation for being "slow". While it may not match the raw speed of C++ or Rust, most "slow" Python code is simply code that hasn't been optimized. Writing efficient Python isn't about obscure tricks; it's about understanding how Python works and choosing the right tool for the job.
This short guide will cover the essentials of making your Python code as performant as possible.
Concurrency vs. Parallelism: The Illusion and the Reality
This is the biggest point of confusion in Python performance.
- Concurrency is about dealing with many tasks at once. Think of a chef in a kitchen juggling multiple orders—chopping vegetables while a soup simmers. They are context-switching between tasks.
- Parallelism is about doing many tasks at once. Imagine that same kitchen with multiple chefs, each working on a separate order simultaneously.
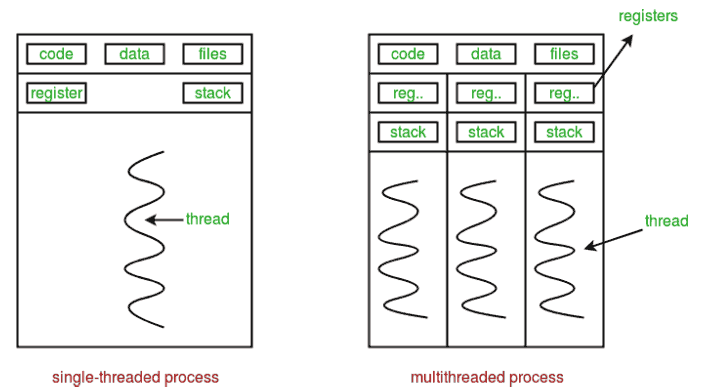
In Python, the Global Interpreter Lock (GIL) is a core feature of the main CPython implementation that prevents multiple threads from executing Python code at the exact same time. This means that even if you have multiple processor cores, Python's threading module only achieves concurrency, not true parallelism.
The Right Tool for the Task
1. For I/O-Bound Tasks: Use threading or asyncio
If your code is spending most of its time waiting for external resources (like making an API call, querying a database, or reading a file), it's I/O-bound. The GIL doesn't matter here because it's released while the thread is waiting.
threading: A great, straightforward way to run multiple I/O operations concurrently. Easy to understand for a handful of tasks.asyncio: A more modern and scalable approach for handling thousands of concurrent I/O operations. It uses a single thread and an event loop to manage tasks, which is extremely efficient for things like high-performance web servers or network crawlers.
2. For CPU-Bound Tasks: Use multiprocessing
If your code is doing heavy computation (like complex math, data processing, or simulations), it's CPU-bound. This is where the GIL is a bottleneck.
multiprocessing: This module gets around the GIL by creating separate processes, each with its own Python interpreter and memory. This allows your code to run on multiple CPU cores in true parallelism. It's the go-to solution for heavy computational workloads.
Writing Efficient Code: Beyond Concurrency
1. Avoid Reinventing the Wheel: Use Built-ins and Libraries
Python's built-in functions (like sum(), map(), filter()) and data structures are written in highly optimized C.
- Don't write a
forloop to sum a list; usesum(my_list). - For numerical data, use libraries like NumPy. NumPy operations are vectorized and executed in compiled C or Fortran code, making them orders of magnitude faster than manual Python loops for array calculations.
2. Be Smart About Memory: Garbage Collection and Generators
Python handles memory management automatically through a process called garbage collection. It primarily uses a technique called "reference counting," where an object is deleted as soon as its last reference is gone. While it's automatic, you can still help it:
- Use Generators: When you need to iterate over a huge sequence, don't create a massive list in memory. Use a generator. A
forloop overrange(1_000_000_000)starts instantly and uses almost no memory, whereaslist(range(1_000_000_000))will likely crash your machine. - Interact with the Garbage Collector: Python provides the
gcmodule for developers. While you rarely need it, you can manually trigger garbage collection withgc.collect(). This can be useful in specific situations, like after deleting a large object with circular references, to release memory immediately. - Choose the Right Data Structures: A
setis much faster than alistfor checking if an item exists (if item in my_collection:).
The Golden Rule: Profile Before You Optimize
How do you know which part of your code is slow? Don't guess, measure.
Python has excellent built-in profiling tools. cProfile is a great starting point. You can run it on your script to get a detailed report of how many times each function was called and how long it took. This will immediately show you the real bottlenecks.
Focusing your optimization efforts on the 20% of the code that takes 80% of the time is the most effective way to improve performance.
Further Reading & Tools
Helpful Articles
- The Python GIL: The article you shared is the gold standard: What Is the Python Global Interpreter Lock (GIL)? on Real Python.
- Concurrency & Parallelism: Real Python also has a fantastic guide here: Speed Up Your Python Program With Concurrency.
- Asyncio: A great starter guide can be found here: Async IO in Python: A Complete Walkthrough.
- Garbage Collection: The official documentation for the
gcmodule is the best source.
Tools for Measurement
- CPU Profiling: The built-in
cProfileis the best place to start for finding time-based bottlenecks. - Memory Profiling: The
memory-profilerpackage is excellent for this. You can run it from the command line withmprof run your_script.pyand then create a visual plot of memory usage over time withmprof plot. - System monitoring and profiling (and more!): The
psutilpackage is a great package for system monitoring, CPU utilization, and more!