Confidence, Credibility, and Corporate Reality: A Guide to Statistical Thinking
Lately, I've been deep in a few projects involving inferential statistics, and it’s taken me back to one of the most fundamental concepts in our field. I still remember the moment when I first truly understood the difference between a confidence interval and a credible interval. At first, I was just confused—why was the less intuitive "confidence interval" so popular? Then, when it clicked, it was a revelation. It felt like I had been given a new lens to see the world, and it sparked a deeper interest in the powerful field of causal inference.
This distinction isn't just academic trivia; it's a cornerstone of thinking clearly about data. Let's break it down.
The Confidence Interval: A Misunderstood Workhorse
You've seen it a thousand times. An analyst presents a result: "We are 95% confident that the average revenue per user for this new feature is between $5.20 and $7.80." Most people, very reasonably, interpret this as: "There is a 95% probability that the true average revenue is between $5.20 and $7.80."
Here's the uncomfortable truth: that interpretation is wrong.
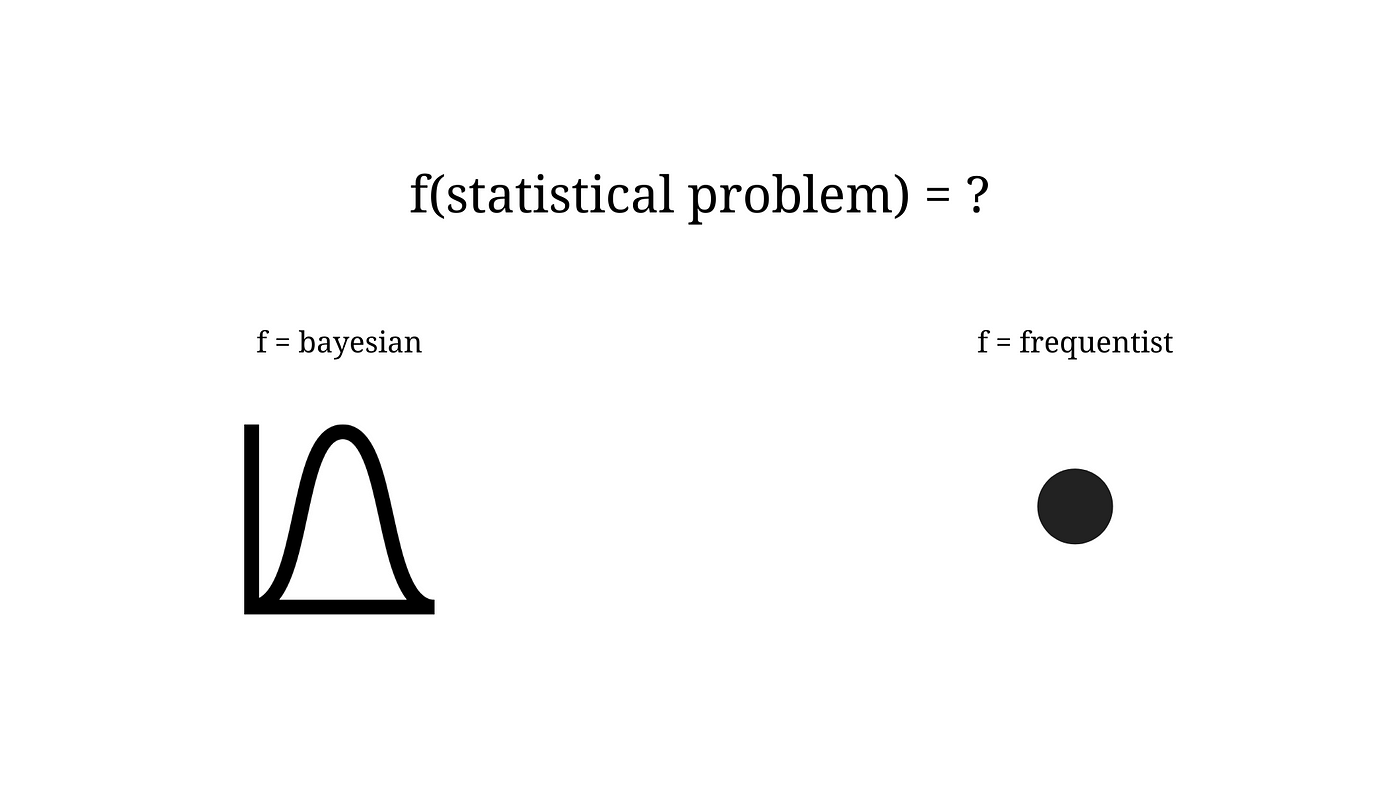
A confidence interval is a frequentist concept. The "95% confidence" doesn't refer to your specific interval; it refers to the method you used to create it. Think of it this way: if you were to run your experiment 100 times, and calculate a 95% confidence interval each time, you would expect the true, unknown average revenue to be captured inside your interval in about 95 of those 100 experiments.
For the one interval you just calculated—[$5.20, $7.80]—the true value is either in it or it isn't. The probability is 100% or 0%. We just don't know which. Your confidence is in the long-term success rate of your procedure, not in the specific result you’re looking at.
They are incredibly useful for standardized reporting and understanding the precision of an estimate (wider intervals mean more uncertainty), but their limitation is that they can't give you the simple probabilistic statement you wish they could.
The Credible Interval: What You Thought You Were Getting
This brings us to the Bayesian alternative: the credible interval.
A 95% credible interval does mean what most people think. It’s a range for which you can say, "Given our data and our prior beliefs, there is a 95% probability that the true parameter lies within this interval."
How does it work? Briefly, Bayesian inference starts with a prior belief about the parameter (e.g., based on past experiments, you might believe the average revenue is likely around $6.00). Then, you collect your data and use it to update your belief. The result is a posterior probability distribution, and the credible interval is simply a 95% slice of that final distribution. It’s a more intuitive and direct way to talk about probability.
Statistics in the Wild: Corporate Experiments
So how does this play out in a real corporate setting? Let's talk about A/B testing, the bedrock of product and marketing decisions.
Imagine we're testing a new checkout flow (Version B) against our old one (Version A). Our goal is to see if Version B increases the conversion rate.
- A Frequentist Approach: We would set up a hypothesis test. The null hypothesis is that there is no difference. We run the test for a fixed period and calculate a p-value and a confidence interval for the difference. If p < 0.05, we declare a winner. The confidence interval gives us a range for the plausible size of the effect, but we can't assign a direct probability to it.
- A Bayesian & Causal Approach: Using credible intervals, we can end the test with a much more powerful statement: "There is a 97% probability that Version B is better than Version A." We can also calculate the "Expected Loss"—the cost of choosing the wrong version. This allows for a direct conversation about business risk. We can ask, "If we roll out Version B, what's the probability it will actually lose us money?"
This moves the conversation from rigid "significant/not significant" labels to a more nuanced discussion about probability and impact. This is where causal inference becomes so powerful—it allows us to move beyond correlation and make direct claims about the effect of our actions.
The Reality of the Corporate World
In a corporate setting, nobody has perfect data. We are constantly dealing with uncertainty, messy logs, and limited resources. We can't always run perfectly controlled experiments.
This is where statistical thinking is most valuable. It’s not about finding a single, "certain" answer. It’s about quantifying uncertainty, managing risk, and making the best possible decision with the information you have. Statistics gives you a robust framework to argue why a certain result is likely not due to random chance, and it provides the language to communicate the level of risk associated with a decision to stakeholders.
Considerations and Final Thoughts
While I find the Bayesian approach and credible intervals more intuitive for decision-making, confidence intervals are still the dominant method in many scientific and industrial fields due to their objectivity (they don't require a prior).
The most important takeaway is to know what your tools are actually telling you. In an era where Machine Learning models can feel like black boxes, a deep understanding of inferential statistics remains the bedrock of a data professional’s toolkit. It allows you to design valid experiments, interpret the results correctly, and ultimately, to guide the business with clarity and intellectual honesty. It’s how we move from just processing data to providing real, defensible insights.